
How investors read a market number
Investors can check market estimates independently. One simplified exit scenario multiplies annual market revenue by an attainable share and a revenue multiple. The multiple must suit the business; profitability, debt, cash, preferences and timing also affect investor returns.
Worked with the numbers used in pricing an early round, a NOK 10 million round at NOK 20 million pre-money gives a post-money of NOK 30 million. An addressable market of NOK 1.5 billion at a fifth of it is NOK 300 million of revenue.
At twice sales, enterprise value is NOK 600 million. Assume zero net debt so equity value is also NOK 600 million. Two later rounds each diluting existing holders by 20% leave 64% of the original one-third stake: 21⅓%, worth NOK 128 million, or 12.8 times the investment. This illustration excludes other dilution, preference waterfalls, fees and tax. Test the market, share and multiple separately.
A top-down report can provide context or a cross-check, but a percentage of a broad category does not explain the route to customers. Show who buys, what they pay and how the company reaches them.
Use the estimate to explain the buyer segment, evidence of demand and the size of the opportunity. A bottom-up calculation makes the assumptions easier to inspect; it does not by itself prove demand.
The bottom-up build
Market sizing (markedsstørrelse) built from the ground up follows Bill Aulet’s method from MIT, an American source with a stated method. Divide the market into countable units, find real instances of them, count the end users in each, and establish what each pays a year by asking, since estimating is where the optimism gets in.
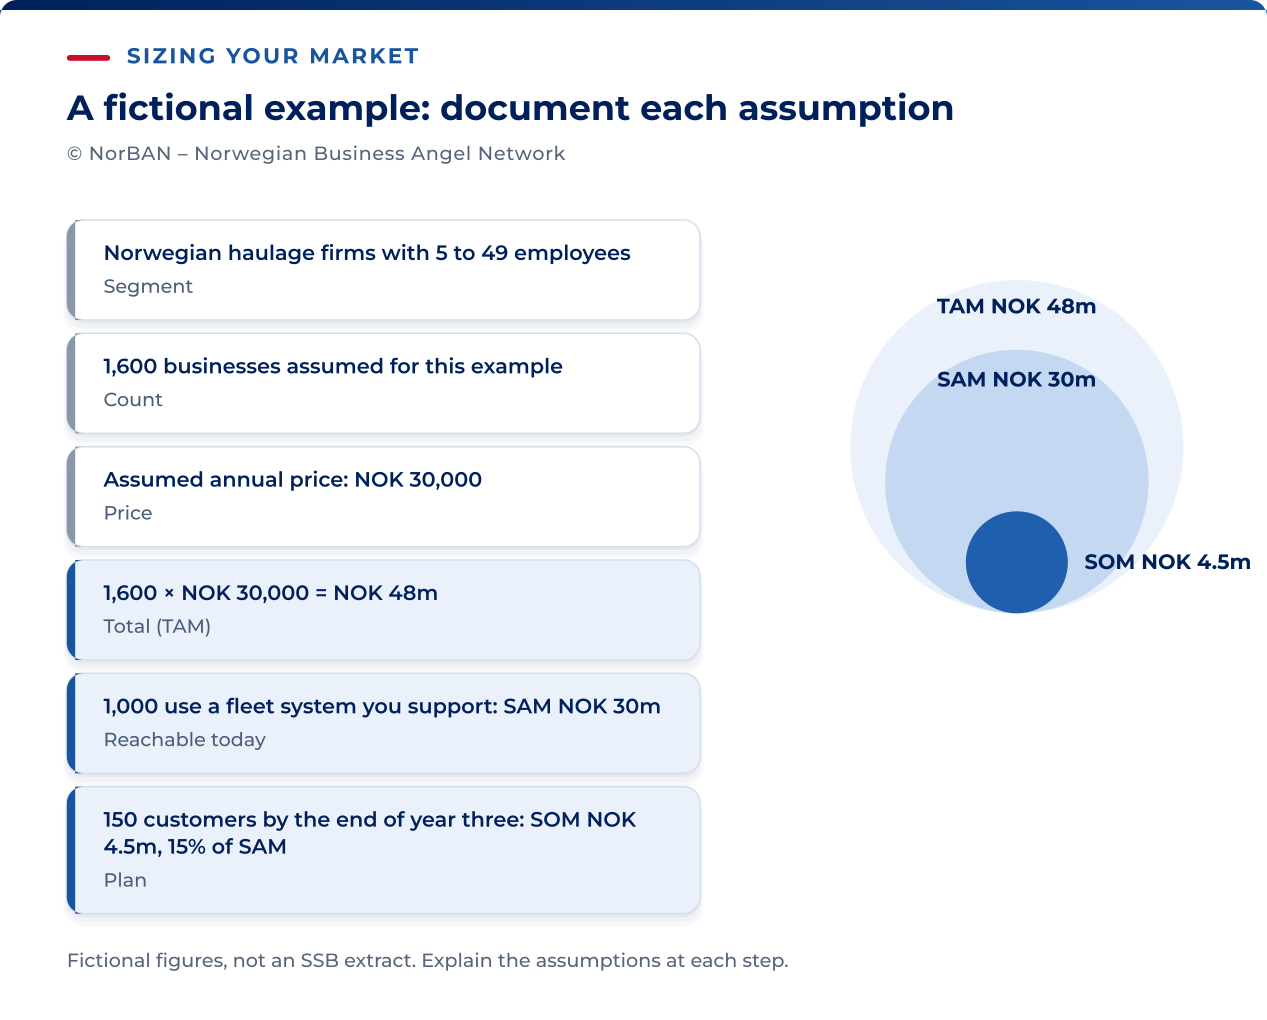
Build the estimate from the segment through to adoption. Show the source for each input so investors can check your assumptions.
- Segment. Define buyers with a shared need clearly enough to count. Technology categories alone seldom identify the purchasing units.
- Count. Use a relevant public table or another documented method. State exclusions and uncertainty.
- Price. Use actual customer evidence where available. Label untested prices, pilot discounts and expected changes.
- Frequency. State whether payment is one-off, recurring or use-based, and keep the period consistent.
- Reach. Explain how many buyers the plan can acquire, by when, through which channels and with what evidence of sales capacity.
Consider a fictional maintenance-planning software company with two pilots paying NOK 2,500 monthly. It targets Norwegian freight-transport buyers with 5–49 employees, assuming these firms need the product and do not build an equivalent internally. These are teaching assumptions to test, not measured market facts.
| Input | Illustrative value | Evidence a real company would need |
|---|---|---|
| Segment | Norwegian freight-transport buyers with 5–49 employees | Define the purchasing unit and test the need with customers |
| Count | 1,600, invented for this example | A dated, filtered statistical extract or documented count; do not attribute this value to SSB |
| Price | NOK 30,000 annually | Actual pilot or customer terms and explanation of discounts |
| Frequency | Annual contract billed monthly | Contract evidence |
| Serviceable now | Assumed 1,000 of 1,600 using the two supported telematics systems | Product integrations and evidence of buyer system usage |
| Planned reach | 150 active customers at year-three end | Sales capacity, acquisition timing and churn in the model |
For a real estimate, retain evidence for each line: the statistical extract, customer agreements, integration coverage and sales plan. The worked example supplies assumptions, not those documents.
TAM, SAM and SOM as computations
The three terms are widely used and loosely defined, so define each one by the arithmetic that produces it, starting from Aulet’s TAM.
The total addressable market (TAM) is the annual revenue you would earn at 100 per cent share of the segment you counted. For the haulage company it is 1,600 establishments at NOK 30,000 a year, NOK 48 million. It is the size of the segment at your price, before any question of the company’s ability to sell.
The serviceable addressable market (SAM) is the part of TAM the current product and sales channels can serve. Explain the limits. In this example, the product supports two telematics systems assumed to be used by 1,000 customers. SAM is 1,000 × NOK 30,000 = NOK 30 million. Additional integrations may make the product relevant to more customers.
The serviceable obtainable market (SOM) is the share of the SAM the plan claims within its horizon. It is a plan, so it comes with a channel and a rate. The haulage company plans 150 customers by the end of year three, which is NOK 4.5 million of annual recurring revenue and 15 per cent of the SAM.
SOM should reconcile with the financial model. Suppose active customers reach 20 at year-one end, 70 at year-two end and 150 at year-three end. Year-end annualised revenue is not the same as revenue earned during the year; acquisition dates and churn must also be modelled.
If the model and market slide give different customer counts, reconcile them before presenting either. A mismatch undermines confidence in both.
An investor who accepts the count and the price will spend the meeting on the SOM, because the SOM is where the company’s claims about itself begin. Three salespeople each closing two or three firms a month is a checkable rate, and the unit economics decide whether the counted market is worth serving at that cost.
Sourcing the inputs
Official statistics can provide a reproducible starting count where the units and categories match your segment. Check coverage and whether the counted units can actually buy. SSB publishes establishment statistics and separate enterprise statistics.
Cite the table, reference year, filters, classification version and extraction date. Table 07091 provides establishment counts by industry and employee group and still labels its series SN2007/SIC2007. Check the metadata rather than assuming every current table already uses the newest classification.
An establishment, an enterprise and a legal entity are not interchangeable statistical units. A business with several locations may have several establishments but one central buyer. Decide whether you sell per location, legal entity, group or user before counting.
Use Brønnøysundregistrene to identify relevant registered entities and inspect available company information. Coverage, access and filing obligations vary. A company list is a research starting point, not proof of need or permission for every form of outreach.
For another country, compare units, reference years, size definitions, coverage and classification versions. Eurostat’s transition to NACE Rev. 2.1 is phased, and correspondence tables help map older categories. A matching-looking industry code alone does not make Norwegian, Swedish and Danish counts comparable.
Use research on Norwegian private markets alongside the official statistics, taking account of each source’s scope. Menon Economics publishes analyses of Norwegian startup and growth companies, generally commissioned by public bodies and openly available, and the Norwegian Venture Capital & Private Equity Association publishes recurring studies of capital access.
Commercial private-market databases such as Dealroom cover deals. They are more useful for researching competitors than for counting potential customers.
Your own pilot prices, sales-cycle times and conversion rates provide company-specific evidence. State the sample, discounts, selection and founder involvement before generalising them to a larger market.
Branch organisations publish industry statistics, and they are advocacy publications. Cite them as such, or use them to find the SSB table they were built from.
On the slide, each input carries its source in a form the investor can follow. A line reading “SSB table 07091, industry code and size class as shown, extract March” has done the investor’s checking for them.
The sizing mistakes that end conversations
In his 2006 essay, Guy Kawasaki criticised sweeping research-firm market forecasts and the assumption that winning just 1% would be easy. The practical lesson is to explain the actual customer route, rather than rely on a small-looking percentage of a large headline number.
Aulet recommends testing top-down estimates with buyer-level research because broad categories can miss important differences. This is a method to apply and assess, not proof that every top-down estimate or Norwegian pitch is wrong.
Replace broad market labels with calculations an investor can check to avoid these common mistakes.
| Pitfall | Why it matters | Better approach |
|---|---|---|
| “Only 1%” | A share does not explain acquisition | Derive the share from buyers, price, channel and capacity |
| Broad report headline | The category or method may not fit your product | Check scope and triangulate with buyer-level evidence |
| Marketplace volume called revenue | Volume and the platform’s own revenue differ; principal/agent accounting matters | Show GMV, fees and take rate separately; see a16z |
| SOM without a channel | The planned share lacks a route to sales | Model sales capacity, cost, timing and churn |
| A technology label without buyers | It may not identify purchasing units | Name and count the relevant buyer groups |
| Mixed units or classifications | Counts cannot be added directly | Reconcile units, versions, periods and overlaps |
| Untested list price | It may overstate achievable revenue | Show observed prices and clearly labelled pricing scenarios |
Small markets, stated honestly
In the example, NOK 48 million annual revenue at 100% share and a 2x multiple gives NOK 96 million enterprise value. That assumed ceiling is not a valuation conclusion: full penetration and the multiple are uncertain, and margins, growth, debt, cash and distributions matter. Assess whether the realistic outcomes fit the amount and type of funding sought.
Acknowledge the home market’s limits on the slide, then show the second market. A Norwegian beachhead is a strength when the deck treats it as one: a segment you can count exactly, sell into in your own language, and prove the model on before spending anyone’s money abroad. The weakness is a beachhead presented as the whole plan.
If expansion is part of the investment case, explain the order of markets and the evidence needed for each step. Ask prospective investors what scale and return their investment approach requires.
- Name the next market and explain the choice. A neighbouring country may help, but language, buying behaviour, regulation and competition still need testing.
- Count on a comparable basis. Reconcile classifications and units, and test local pricing and purchasing power rather than copying the Norwegian price automatically.
- Name the milestone funded now. It might be a foreign pilot, distributor agreement, experienced hire or a costed product adaptation.
- Show what transfers and what does not. Norwegian sales and retention inform the plan but do not prove that another market will behave alike.
Adapt the evidence to your stage and to who is leading the round.
- First raise. Count the starting segment and label price assumptions. If international growth is planned, explain its timing and what this round will test.
- Later raise. Compare the previous customer target with actual results, explain differences and update the market-entry plan.
- With a lead. Share the calculation and sources before the meeting so the assumptions can be discussed.
- Without a lead. Give everyone the same calculation and source dates. Keep source extracts and appropriately shareable customer evidence available.