
What a metric does for an investor
Clear definitions let investors compare your figures with relevant businesses. Their experience and preferred measures vary, so make the calculation understandable without assuming they use your definitions.
An unfamiliar definition slows that comparison. Once investors discover that you use one, they need to check the basis of every other figure on the slide too.
Clear definitions help you answer investors’ practical questions. An angel working through your business model asks, in ordinary words:
- Does the company have paying customers? How much does it cost to acquire one customer?
- What is the likely, average length of customer retention and rate of customer turnover?
- Is the price fair? Is it a premium? How are the sales margins?
- How much do they need to sell, and for how long, to reach a break-even point?
- How much and how fast can they scale up their sales, and how will expenses scale with higher sales volumes?
- Does the startup have deep customer insight and understanding of the customers’ decision processes?
These questions concern acquisition cost, retention, margin, break-even and how costs change as sales grow. Unit economics (enhetsøkonomi) is the name for the set of numbers that answers them: what one customer earns you over the time they stay, against what it cost to win and serve them.
The core set, defined exactly
The linked a16z guide from 2015 and David Skok’s SaaS guide offer useful explanations, with differing conventions in places. They are not universal accounting standards. Define your method, reconcile it to your records and distinguish reported accounts from management metrics and forecasts.
| Metric | Calculation and basis | What to explain |
|---|---|---|
| Customer acquisition cost (CAC) | Acquisition costs divided by acquired customers. Include the relevant sales and marketing costs, payroll, incentives and allocated resources. Show paid-channel and blended CAC when relevant, with matching cost and customer populations. | Sales-cycle timing, cost allocation and any estimated value of unpaid founder time. A management estimate of time is not necessarily a booked expense. |
| Gross margin | (Revenue − cost of sales) / revenue × 100%. Define included production, delivery and support costs consistently. | Hosting, payment, onboarding, support, hardware and third-party licence costs as applicable; disclose classification differences rather than assuming all firms classify them alike. |
| Customer lifetime value (LTV) | Specify whether you use gross profit, contribution after variable costs, or discounted net profit over the relationship. Revenue alone is not profit-based LTV. | Retention and margin assumptions, discounting and which costs are deducted. A projected 24-month contribution is not observed lifetime value. |
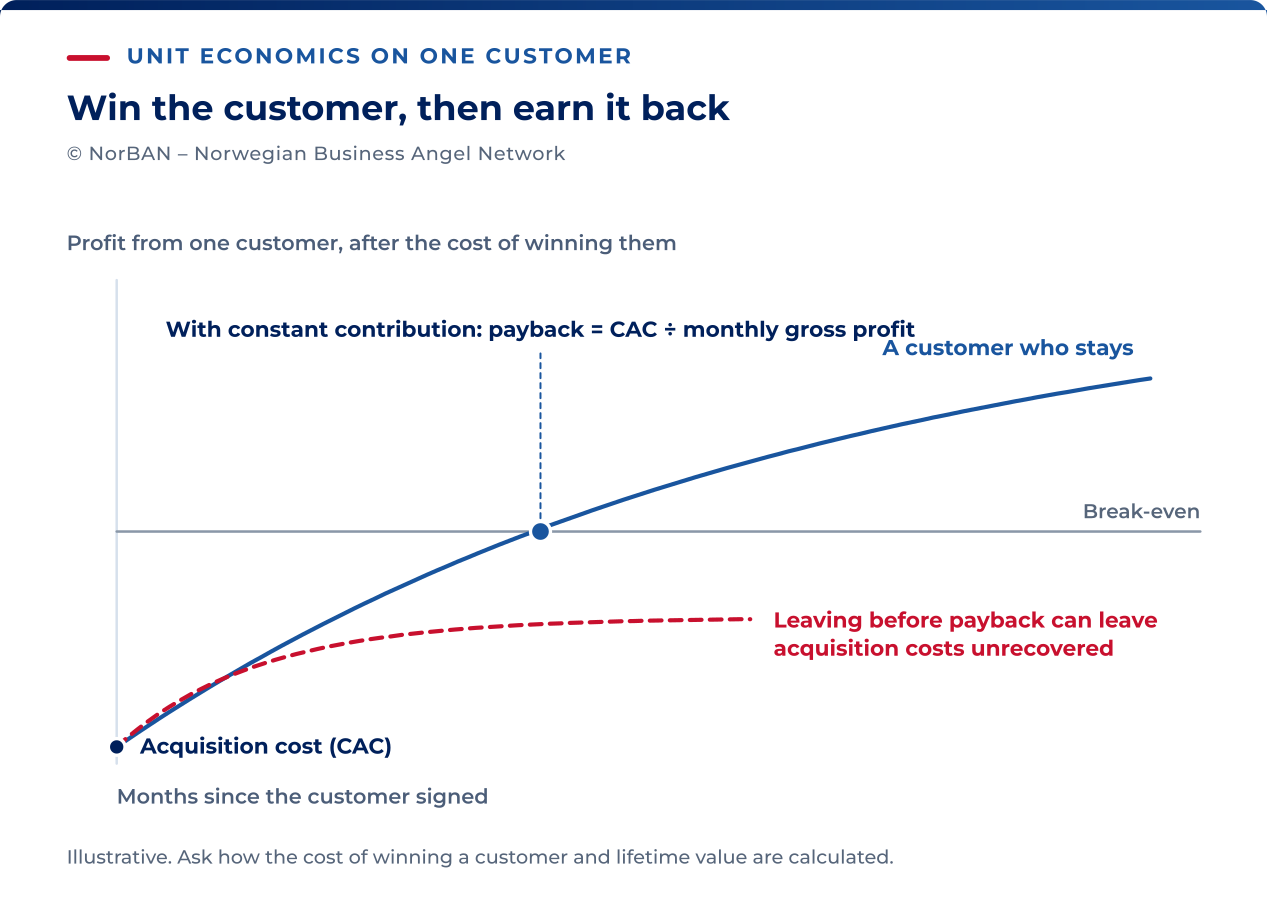
| LTV:CAC and payback | Compare LTV and CAC for the same customer population without deducting acquisition cost twice. With a constant positive monthly contribution, simple payback is CAC / monthly contribution. | Use a monthly contribution schedule if margins vary. State whether the basis is gross profit or a narrower contribution measure. |
| Customer churn, gross revenue churn and NRR | Customer churn = customers lost / opening customers. Gross revenue churn = opening recurring revenue lost through cancellations and contraction / opening recurring revenue. NRR = ending recurring revenue from the opening cohort / that cohort’s opening recurring revenue. | Exclude new customers from NRR; include expansion, contraction and churn within the opening cohort. State period, currency treatment and reactivation policy. Show gross losses as well as NRR. |
| MRR and ARR | Normalised monthly recurring revenue; annualised ARR is commonly 12 × MRR. Exclude one-off fees, setup, hardware and non-recurring consulting. | Distinguish active recurring revenue from signed future bookings, invoices, cash receipts and recognised accounting revenue. Define treatment of variable usage. |
| Burn and runway | Define cash burn and reconcile it to cash movements. Separate operating outflows and receipts from financing and other movements. Available cash / constant positive monthly net burn gives a simplified runway. | Restricted cash, grants, taxes, equipment, debt payments, seasonality and planned hiring. Use a cash forecast when payments vary; zero or negative burn does not give a useful finite ratio. |
| Burn multiple | Net burn / net new ARR over the same period, as described in David Sacks’ 2020 guide. | A zero denominator is undefined. A negative denominator does not measure efficient growth. Define burn and explain unusual cash movements. |
The headline metrics per model family
Choose a small set of main measures suited to your business model and keep supporting detail available. The following are practical suggestions, not a universal investor scorecard.
| Model | Useful measures | Common distinction |
|---|---|---|
| Subscription or SaaS | MRR/ARR, churn, NRR, relevant channel CAC, contribution and payback | Separate recurring income, new bookings and one-off charges. |
| Marketplace | GMV, fees or commission, take rate, buyer/seller cohorts and manual fulfilment | GMV is transaction volume. Revenue recognition depends on the principal/agent role. For a pure commission model, GMV divided by commission revenue equals 1 / take rate; that is not automatically a valuation error of the same size. See a16z. |
| Direct product sales | Order contribution after products, delivery, returns, payments and attributable acquisition; repeat purchase and order value | Give cohorts enough time to reorder, where repeat purchase is relevant. |
| Hardware with services | Margin at actual volume; separately labelled higher-volume estimates; contracted and actual service revenue; cash conversion timing | A supplier quotation for ten times current volume is a scenario, not today’s realised margin. |
| Licensing/IP | Contract value, duration, minimums, invoices, cash collected and recognised revenue; maintenance and enforcement costs | An unpaid invoice can still be recognised revenue if accounting conditions are met. Total signed licence value is not automatically current revenue. |
| Services moving to product | Revenue and margins by activity, custom work and revenue per employee | Do not label one-off consulting as recurring software revenue; identify genuinely recurring service contracts separately. |
| Public-sector sales | Contract awards, framework limits, actual call-offs, invoices and revenue; dated procurement pipeline | A framework ceiling is not guaranteed sales. A paid pilot may itself be a procurement but does not guarantee a wider contract. |
If your company combines two model families, report both sets of metrics. Explain which model the round will fund, since that determines how the investor values the business.
What matters at each stage
The questions above do not change between rounds. What changes is which questions you can answer with measured numbers. Investors are more sceptical of a premature figure than of an assumption clearly labelled as one.
Pre-seed
Measure cash balance and historical spending from reconciled records. Forecast runway from expected receipts and payments, including planned hiring. It is an estimate, not an exact fact merely because the company is pre-seed.
You can calculate margin on a single completed delivery or pilot if revenue and costs are known. Distinguish the price actually paid from a proposed price in a letter of intent, and explain unusual pilot discounts or costs.
CAC may be measured for early sales, but a few founder-led wins may not predict a scalable channel. Show the channel, cost allocation and hours spent, then label the forecast separately.
Omit metrics the evidence cannot support. A pre-seed company may have paying or recurring customers, so the stage label alone does not decide this. Burn multiple needs positive net new ARR; reliable retention analysis needs an appropriate observation period and cohort.
Seed
At seed, your customer list should support every metric you present. For each customer record the start month, the price paid, the channel that produced them, and whether they are still paying.
CAC then comes from the actual spend over the customers on that list, with your own selling time costed in. Gross churn comes from the customers who left it.
Show contribution actually earned to date, and 12- or 24-month cohort values only where that history exists. Forecasts beyond observed history need separate labels and retention assumptions. Payback can also be projected, but realised payback requires enough history. Burn multiple has no universal one-year waiting period; use consistent periods and positive net new ARR.
Skok describes LTV:CAC above 3 and payback of 5–7 months in strong SaaS businesses, and illustrates weaker cash economics beyond 12 months in his model. He expressly calls these guidelines with exceptions, not universal profitability tests.
Sacks’s 2020 guidance has the burn multiple improving as a company matures, with around 3 at seed, 2 as reasonable for an early-stage company and 5 as terrible.
Use these dated US-oriented guides to form questions, not pass/fail rules for a Norwegian seed company. Check whether acquisition channels, contract values, margins and maturity are genuinely comparable.
Approaching Series A
The investor pricing the next round wants evidence that you can repeat the results. They want sales closed by someone other than a founder, cohorts old enough to have renewed, a margin that holds as customers get larger, and a plan whose next twelve months extend the last twelve.
SaaS Capital’s 2025 private B2B SaaS report gives median NRR of 102% and a top-quartile figure of 111% for annual contract values of USD 25,000–50,000. Check the report’s population and metric definitions before using these as comparators.
The report associates higher contract values with stronger net retention and presents results for private B2B SaaS businesses. Its growth analysis identifies a subset with more than USD 1 million ARR; do not describe every respondent as having exactly USD 1 million. Compare the stated cohort, not an assumed funding-stage threshold. Sacks’ post-Series-A multiple of about 2 is an illustration, not a market requirement.
Build the seed round’s plan so that the end of the runway produces the four kinds of evidence above. Ask the investor you expect to price the next round what they want to see, before you build the deck.
What is noise too early to mean anything
- Burn multiple with zero or negative net new ARR.
- Lifetime value extrapolated from a short, unstable retention history without scenarios.
- Growth percentages without the underlying small customer counts.
- Retention measured before relevant renewal opportunities, without that limitation stated.
- Founder-network CAC presented as proof of a different, untested acquisition channel.
When the numbers are small
One lost customer out of twelve is about 8.3% monthly customer churn. Repeating that rate for twelve months would imply about 64.8% annual churn: 1 − (11/12)^12. That is a mathematical scenario, not a reliable annual forecast from one loss. Zero losses in a small sample likewise does not prove zero future churn.
Neither rate reliably describes the business. Presenting it without the customer detail suggests you have overlooked the small sample.
Suppose twelve customers have started paying NOK 2,500 monthly, the oldest nine months ago, and one has since left. Show a table of all twelve with start month, price, channel and current status, using suitable identifiers. One row might say “left in month four after a change of owner.” Make clear that eleven are still paying.
The investor draws their own conclusion about retention from that table, and it is a better one than any rate you could quote. You can still calculate the other core metrics from the same twelve customers:
- At a stated 70% gross margin, each paying customer contributes NOK 1,750 monthly after the included hosting, payment and support costs.
- Quarterly acquisition costs are NOK 90,000 for six new customers: blended CAC is NOK 15,000. This management figure includes the stated value of founder sales time. NOK 40,000 of matched paid-channel costs produced two customers: paid CAC is NOK 20,000.
- With constant monthly gross profit, no churn and no additional deducted costs, simple projected payback is 15,000 / 1,750 = 8.6 months, or 20,000 / 1,750 = 11.4 months for paid acquisition.
- If a customer stays for 24 months at that price and margin, projected gross profit is NOK 42,000, giving 42,000 / 15,000 = 2.8. This is a conditional 24-month gross-profit scenario, not observed LTV or discounted net profit.
- NOK 3.2 million in unrestricted available cash divided by assumed constant net burn of NOK 320,000 monthly gives ten months. Update the cash forecast for actual changes.
Showing the calculation helps investors assess how well you understand the numbers. The same twelve customers presented as “LTV:CAC of 5” with the working hidden reads as one that does not, and the working is the first thing asked for.
Before revenue, distinguish forms of demand evidence: paid pilots, priced letters of intent, deposits and pre-orders have different conditions. Show binding status, refund rights, expected conversion and uncertainty. Unpaid interviews can inform need but should not be counted as contracted revenue.
Use precision that matches the evidence. Exact historical amounts should reconcile to records; forecasts and estimated time costs should not imply greater certainty than they have. Keep calculations available in the appendix or data room.
The recomputation test
Reconcile slide metrics with the financial model and underlying records. If they differ, investigate both; the model is not automatically correct. Align cohort, period and cost definitions, including any lag between acquisition spending and resulting sales.
Gross margin should reconcile to revenue and the stated cost-of-sales basis. Reconcile MRR to active recurring contracts, explaining differences from invoicing and recognised revenue. Runway should follow the cash forecast.
Reconcile the figures before sending the file. Use one sheet with a row for each metric, showing its source cells in the model and its value in both the model and the slide. Where the two differ, fix the model or fix the slide, and say which one you changed if the investor has already seen a version.
The same sheet answers the market question that sits beside the metrics in every reading of the plan, because the customers the revenue build adds are the share of the market the plan claims. When the slide, model and market estimate agree down to the customer count, a seed company gives investors strong evidence that it manages its numbers carefully.