
The model as a future P&L
Read the business model (forretningsmodell) slide as the basis of a future profit-and-loss statement. Restate the pitch in three lines of your own: where the revenue comes from, what it costs to deliver each unit of it, and which costs stay flat as revenue grows.
If the deck does not let you write those three lines, the model is undefined however good the product is. The first meeting then starts with how the company makes money and who pays.
Distinguish three types of revenue. Recurring revenue is a subscription or a contract that renews unless the customer acts. Transactional revenue is a fee per event, where the customer chooses again every time. Project revenue is invoiced once when the work is delivered and says nothing about next year.
Revenue from repeat payments helps you assess future income. Revenue from a one-off project needs to be replaced by new work. Ask how much revenue is likely to continue; its reliability affects how a price is reached.
The significance of multiple revenue streams depends on the company’s stage. Before the first stream is repeatable, a second one usually means the first has not been proven and the company is hedging with your money.
Once the first is repeatable, a second is resilience. Ask which stream the next twelve months are spent on, and treat the answer as the model.
Take one company as the running example: a subscription software business selling to operations managers at NOK 4,000 a month per site. Every number that follows is a question you can put to a company like it.
The unit-economics core
Unit economics (enhetsøkonomi) is the profit or loss on one customer over the time they stay. Five numbers cover it, and the definitions that follow are Andreessen Horowitz’s, chosen so the same word means the same thing in every case you compare.
- Customer acquisition cost (CAC) is the full cost of acquiring one customer, stated per customer. Paid CAC counts paid marketing only; blended CAC spreads all channels, including the founder’s own network and referrals, across every customer won. Paid CAC is the one that tells you whether acquisition scales once the founder’s contacts are used up.
- Lifetime value (LTV) is the present value of the future net profit from a customer over the length of the relationship. Most decks compute it on revenue or on gross margin. The definition is on net profit, and the gap between the deck’s version and that one is the first question.
- Gross margin is revenue less every cost of making, delivering and supporting the product. Ask what is in and what is out, because hosting, onboarding staff, support and payment fees each move the figure by several points.
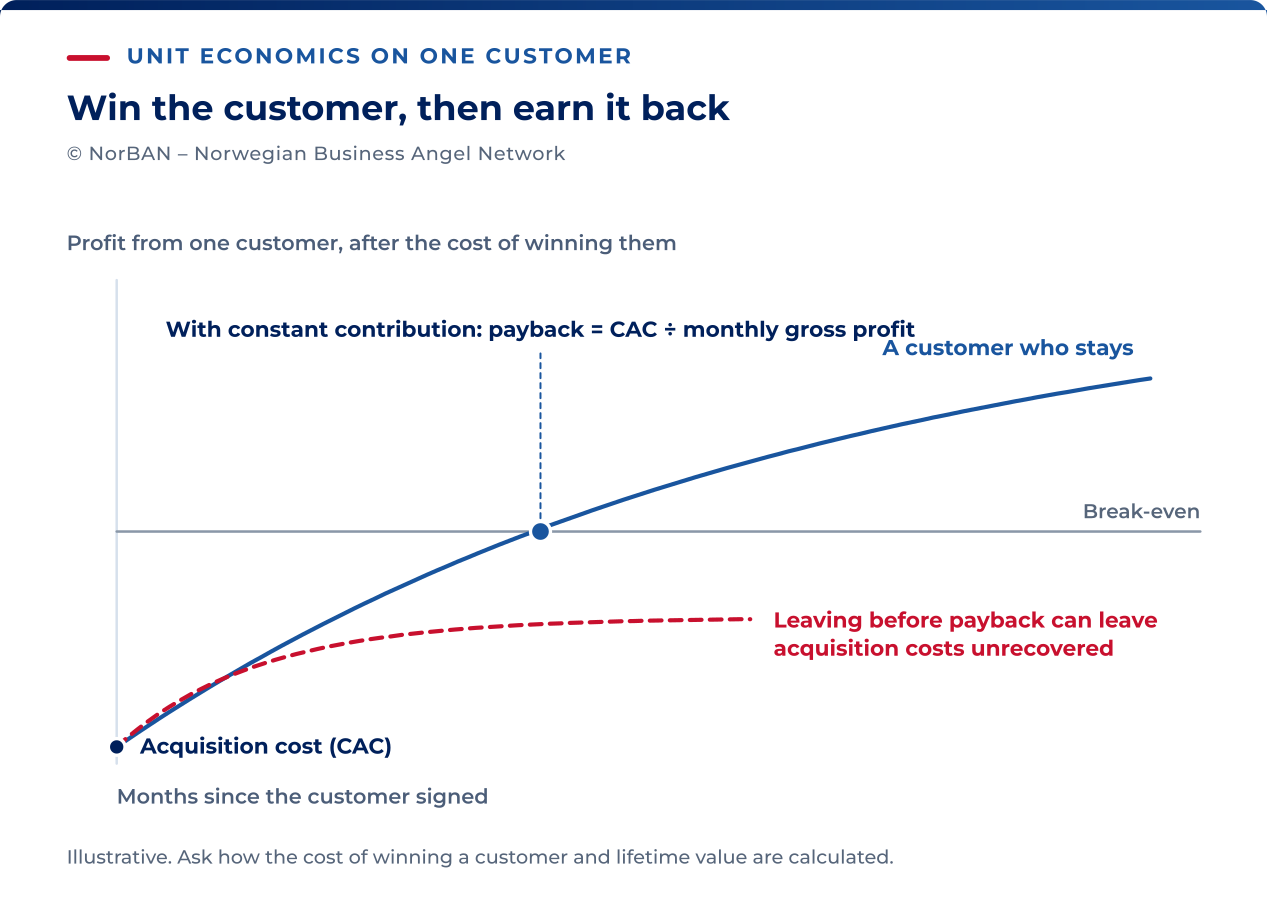
- Payback is arithmetic: acquisition cost divided by the monthly gross profit from one customer gives the months it takes to earn the acquisition back.
- Churn (kundefrafall) comes in three versions. Monthly unit churn is customers lost divided by the customers you started the month with. Gross revenue churn is recurring revenue lost divided by the recurring revenue at the start of the month. Net revenue churn nets expansion from existing customers against the losses and flatters the picture. Ask for gross.
When a number looks unusually good, check its definition before treating it as evidence of a strong business.
| Number | What it tells you | When it looks too good, ask |
|---|---|---|
| Acquisition cost | Whether the company can buy growth at a price the customer’s value covers | Is this paid or blended, and does it include the founders’ time and the free trial? |
| Lifetime value | What a customer is worth once acquired | Is it computed on revenue, gross margin or net profit, and over what assumed lifetime? |
| Gross margin | How much of each krone of revenue is available to pay for acquisition and overhead | Which delivery and support costs sit below the line as “operating” instead of above it? |
| Payback | How long the company’s cash is tied up in each customer before the customer earns it back | Is the monthly gross profit in the calculation the same figure as in the margin slide? |
| Churn | Whether the customer base compounds or leaks | Is this gross or net, unit or revenue, and over which months? |
For the example company, a gross margin of 75 per cent gives NOK 3,000 of gross profit per site per month. With a blended acquisition cost of NOK 30,000 the payback is ten months.
At 3 per cent monthly unit churn the average site stays about 33 months, so the lifetime gross profit is close to NOK 100,000, roughly three times what it cost to win.
Computed on net profit the lifetime value is lower, and the founder should be able to say by how much. Those figures suggest the business can work, but do not establish that it will.
What good looks like, by model type
Published benchmarks exist for one model family, and what they measure matters more than the numbers. SaaS Capital, an American lender, surveys private business-to-business software companies above USD 1M of annual recurring revenue each year, and its 2025 edition gives retention by annual contract value.
For contracts of USD 25,000 to 50,000 a year the median net revenue retention was 102 per cent, with the top quartile at 111 and the bottom at 97. Retention rose with contract size across the survey, and companies at 110 per cent or above grew faster than the survey’s median.
Every company in that survey is past seed by definition, so the range tells you what a later investor will measure a subscription company against once it has a million dollars of recurring revenue. At seed the evidence is the cohort, named and counted: who bought, who renewed, who expanded and who left.
That evidence is judged stage by stage in Traction and metrics that matter. For the other model families the decisive number is known and the benchmark range is not, so take the number and not a target.
| Model family | The number that decides | What it has to show |
|---|---|---|
| Subscription and software as a service | Gross revenue churn by monthly cohort | Customers who renew at a rate the acquisition cost can survive |
| Transactional marketplace | Take rate against the cost of making a match | Revenue per transaction that exceeds what the company spends, in staff and in subsidy, to bring the two sides together. Andreessen Horowitz’s marketplace metrics measure the health of the matching itself as market depth and match rate |
| Direct product sale | Contribution margin after fulfilment and returns | Money left from each order after shipping, returns, payment fees and the advertising that produced the order |
| Hardware plus service | Gross margin at volume against gross margin on the first units | A bill of materials that falls with volume, and a service line that exists in signed contracts |
Assess a hardware company using measures suited to hardware. Its first units are built at a loss, its cash goes out to component suppliers months before a customer pays, and its margin is decided on the factory floor at the thousandth unit. Judge each family on its own number.
Pricing and margin quality
The price tells you what the founder believes the customer’s alternative to be. A price set against the customer’s current cost of the problem has been tested against a budget. A price set a little under a competitor’s list price tells you less about what the customer is willing to pay.
A price the founder calls fair has usually been tested against nothing. Ask what the customer does today and what that costs them.
Discounting in the pipeline is the earliest margin warning you will get. Ask for the list price and the price actually paid on the last five deals. A gap that widens as the deals get larger means the volume buyers are already taking the margin, and channel partners will take another cut when they arrive.
Ask separately what the gross margin is on the largest customer. It is usually the lowest.
The buying process creates costs that rarely appear on the slide. Ask the founder these questions and include the resulting costs in the acquisition calculation:
- Are the customers experts in what the company sells, or do they struggle to buy it?
- How confident are the customers that they need this kind of product at all?
- Is the sale consultative, with a proposal for each customer?
- Do customers depend on the company for implementation, integration or onboarding, and does the company have to be part of that process?
- Does someone inside the customer have to sell the purchase internally, and does the company have to help them?
- What makes the company the easiest choice for the customer to make?
- What do customers have to learn from the company before they get value from it?
A consultative sale to a customer who needs convincing, an internal champion and an onboarding project is an expensive sale whatever the price on the slide. Every yes in that list lengthens the payback, and a founder who has not costed the answers has not costed the acquisition.
The cost side at scale
Sort the cost base into three kinds. Costs that move with revenue, such as hosting, payment fees, support, fulfilment and sales commission, set the gross margin. Costs such as the next salesperson, second engineer or larger warehouse rise in steps. The plan needs to show when each increase occurs.
Fixed costs stay where they are until someone decides otherwise. Ask the founder how expenses scale with a doubling of sales, and whether the budget for the coming year has the steps in it.
Founder-led sales hide a unit cost. While the founder sells, the acquisition cost on the slide excludes the most expensive salesperson the company will ever have, and the close rate belongs to the founder, who knows the product and is trusted for it.
The first hired salesperson is a cost with no revenue behind it for a period nobody can forecast. Add the founder’s selling time to the acquisition cost before you compare it with anything.
The break-even arithmetic fits on one sheet. For the example company, fixed costs of NOK 500,000 a month, which is a team of four and an office, divided by NOK 3,000 of gross profit per site gives 167 paying sites before the company covers its own costs.
Replacement acquisition grows with the customer base. At 3% monthly churn and NOK 30,000 acquisition cost, it costs NOK 900 per site each month to replace lost customers. That leaves NOK 2,100 of the NOK 3,000 monthly gross profit per site to cover fixed costs.
Break-even is therefore NOK 500,000 divided by NOK 2,100: about 238.1 sites, or at least 239 whole sites. This steady-state example assumes unchanged acquisition cost, churn and margin, no acquisition spending for growth, and no double counting of costs. Ask when the plan reaches that customer base.
Where each model breaks
Each model has a common point of failure. Ask about it in the first meeting so you can investigate before investing.
| Model family | What usually breaks | The question that reveals it early |
|---|---|---|
| Subscription and software as a service | Churn compounds against acquisition spend. Every lost customer has to be bought again, so the acquisition budget grows with the customer base instead of shrinking | What is the gross revenue churn for each monthly cohort over the last twelve months? |
| Transactional marketplace | The marketplace is stuck on one side. Supply is recruited by hand, demand is bought with discounts, and the matches happen because staff make them | What share of transactions happen without anyone at the company touching them? |
| Direct product sale | The contribution margin disappears into fulfilment, returns and the advertising that produced the order | What is the contribution margin per order for the last quarter, after shipping, returns, payment fees and advertising? |
| Hardware plus service | The cash cycle. Components are paid for months before the customer pays, the first units are built at a loss, and the service line is a plan | What is the bill of materials at current volume and at ten times it, and how many months of cash sit between buying components and being paid? |
| A platform with one customer type | A platform whose only paying side is one kind of customer is a product with a grander name | Who is the second customer type, and what have they paid? |
| Services moving towards product | Billable hours are reported as product revenue and the margin of a consultancy is presented as the margin of software | What share of last year’s revenue was delivered by people, and what is revenue per employee? |
At 6% monthly churn, average lifetime falls to about 16.7 months and lifetime gross profit to roughly NOK 50,000. Replacement acquisition costs NOK 1,800 per site each month, leaving NOK 1,200 towards fixed costs.
Under the same assumptions, break-even becomes NOK 500,000 divided by NOK 1,200: about 416.7 sites, or 417 whole sites. Higher churn makes break-even harder to reach, but the contribution remains positive. Check the acquisition capacity and cash needed to reach that scale.
CB Insights’ March 2026 analysis of 431 venture-backed American startups that shut down since 2023 found unsustainable unit economics named as a cause in 19 per cent of the cases with an identifiable cause, behind poor product-market fit and bad timing. Of the causes on that list it is the one visible on a spreadsheet before you invest.
Use the same measures, adjusting the depth of analysis to your experience and role.
- A first-time angel does the break-even arithmetic on one sheet for every case that passes the screen, and asks for gross churn and paid acquisition cost by name.
- An experienced angel goes straight to churn by cohort and the price actually paid on the last five deals, and spends the meeting on whichever of the two the founder cannot answer.
- An angel with a sector focus checks the margin structure against companies they already know, where a founder cannot get past them with a category average.
- An angel in a syndicate gives the model to one member to own, so the founder is asked once and the sheet sits in one place.