
Stages defined by what is proven
A company’s stage is what it has proven, and the round label on the deck is only how much it raised last time. A “seed” round in one company funds the first paying customer; in another it funds the third salesperson. Judge traction by what the company has demonstrated so you can interpret the numbers in their proper context.
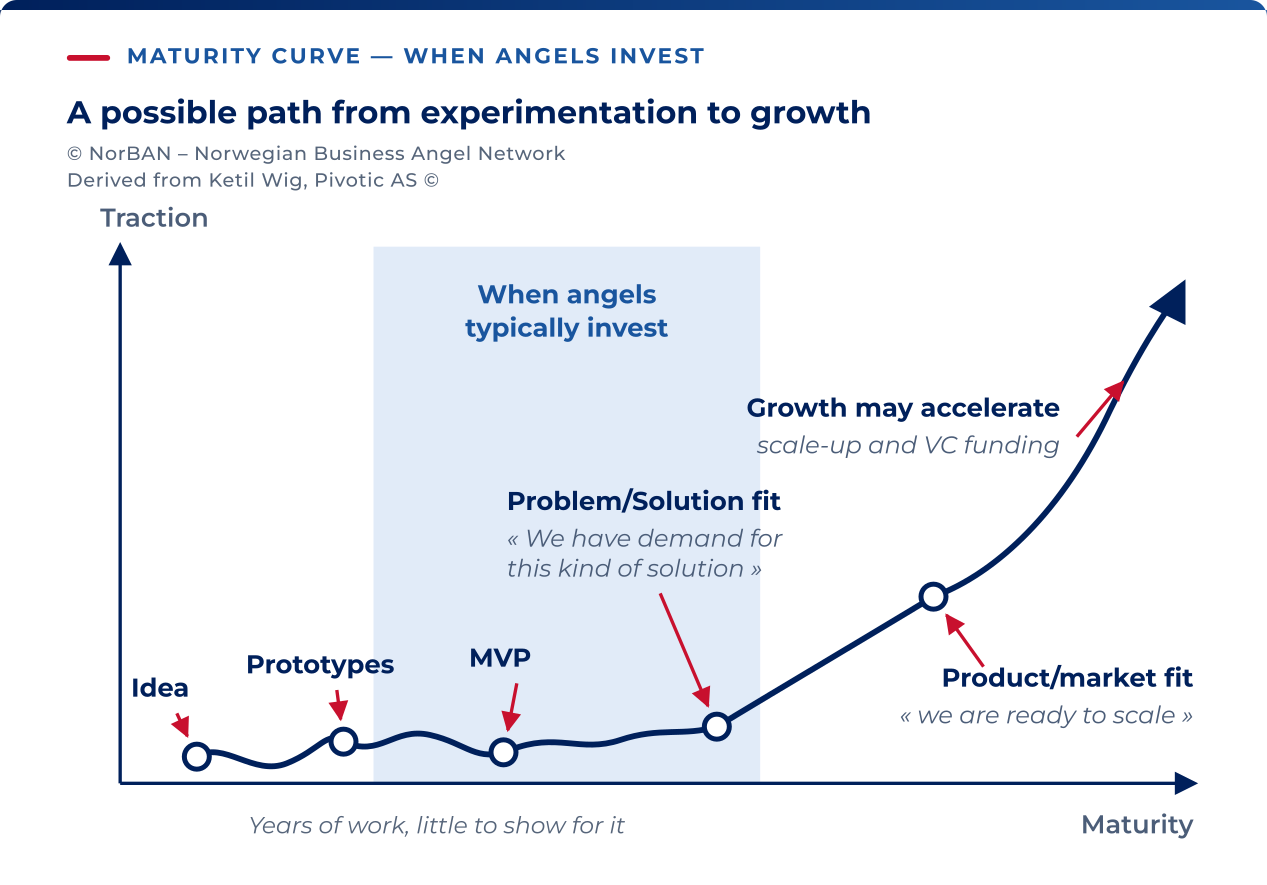
The proof runs through five milestones: idea, prototypes, minimum viable product, problem/solution fit and product/market fit. Problem/solution fit is the point where the company can say “we have demand for this kind of solution”. Product/market fit is the point where it can say “we are ready to scale”.
Angels typically invest from just after the prototypes through problem/solution fit, which is why most of the evidence you will be shown is pre-revenue or barely past it.
Traction develops unevenly across these stages. Traction is almost flat and wanders from idea through the prototypes to problem/solution fit, climbs steadily but without drama to product/market fit, and turns upward there. Product/market fit is where growth begins.
A deck that draws the hockey stick from the founding date has drawn the curve of a company that does not exist. The first screen carries the curve itself.
Steve Blank’s Investment Readiness Level, published in 2013 and modelled on NASA’s technology readiness scale, puts the same idea into a nine-step score. What it scores is evidence: customer interviews conducted, hypotheses tested and validated or invalidated, and what the team learned from them.
Apply the same test to a polished deck: ask for the interviews and findings behind its claims.
Traction at pre-seed
Before problem/solution fit the company has little or no revenue, so the evidence is about demand rather than money. For each form of evidence, ask for enough detail to judge whether it demonstrates demand.
| Evidence | What makes it count | Weight |
|---|---|---|
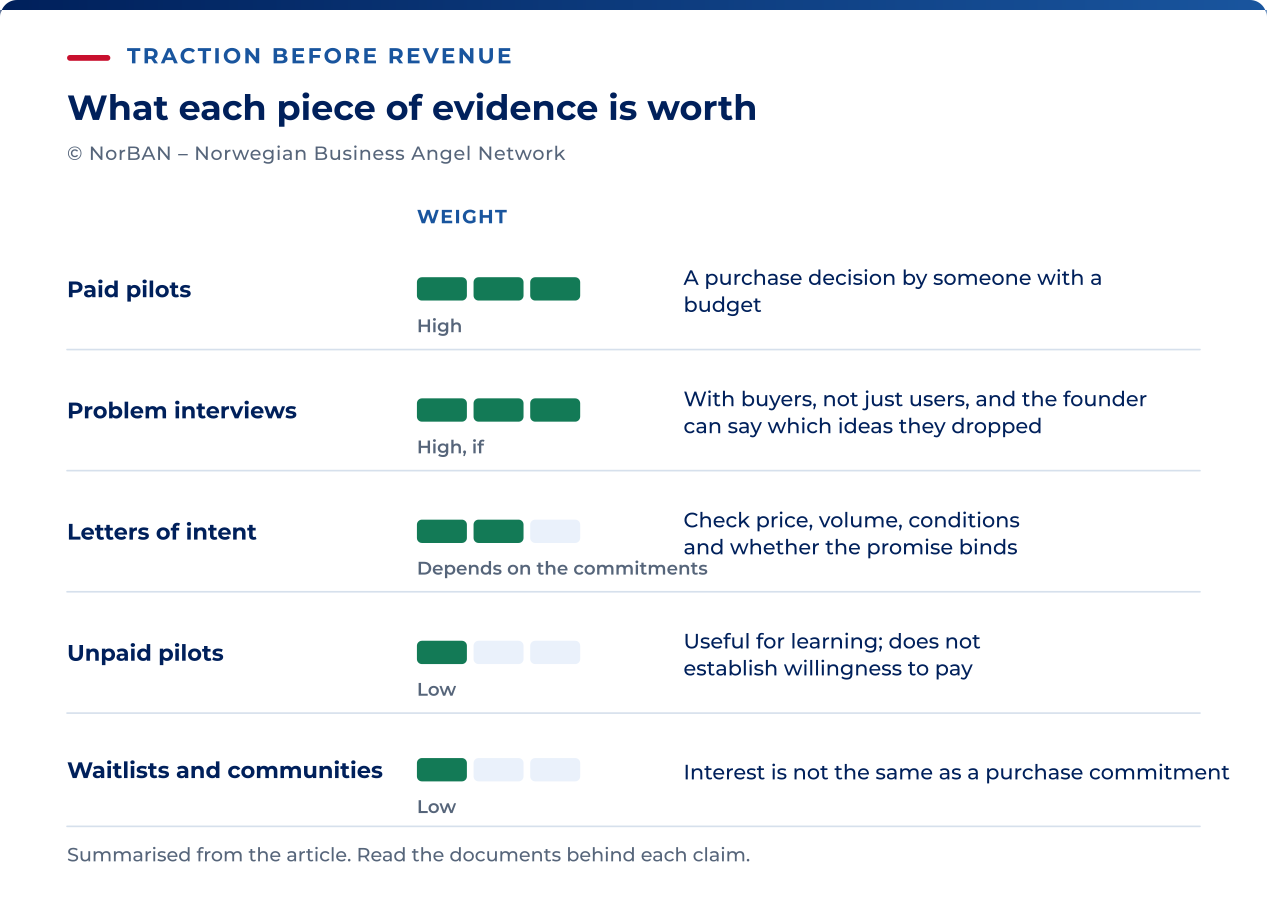
| Problem interviews | A count, a list of who was interviewed by role and company, and what they said in their own words about the problem and what it costs them. Blank’s teams are asked for over a hundred. | High, if the interviews were with buyers rather than users, and the founder can say which hypotheses they killed |
| Paid pilots | A price paid, a scope, an end date, and a written statement of what converts the pilot into a contract | High. A pilot that was paid for is a purchase decision by someone with a budget |
| Unpaid pilots | A scope and an end date, and a named person at the customer who will take the conversion decision | Low. Free is a favour to the founder, and favours do not renew |
| Letters of intent (intensjonsavtale) | A price, a volume, a date and a signature from someone who holds the budget. Read the document itself for what the customer commits to and under what conditions | Medium when it names a price and a volume; zero when it says the customer “intends to evaluate” |
| Waitlists and communities | A deposit, a pre-order, or a sign-up that cost the customer something they would notice losing | Low without money attached. A sign-up is a click |
The interview list and the pilot terms are the two documents to ask for at this stage. A founder who has run a hundred interviews has the list; a founder who has run five has a story about a hundred.
Decoration at pre-seed is anything that involves people who will never be invoiced. Survey respondents, a free tier, the founder’s former colleagues and logos of companies “in discussion” all belong in that group. Note them and give them no weight.
Traction at seed
At problem/solution fit and after it, the evidence becomes money and repeat behaviour. Ask for the customer list before the metrics, so the metrics can be traced to individual customers.
Check the list’s completeness against billing records, including customers who have left. For each customer you want the acquisition source, the start date, the price paid, and whether they are still paying.
Use the list to examine four points, asking the founder to identify the customer records that support each claim.
- Paying customers. Who pays, how much, and since when. A customer on a pilot price is a pilot; a customer paying the list price is a customer.
- Retention and depth of use. Of the customers who started more than a year ago, how many are still paying, and are they using more of the product or less. Renewal is the strongest evidence a seed company can show, and the easiest to verify because the customer will confirm it.
- Sales beyond the founder. Who closed each deal. Ten customers closed by the founder from personal contacts prove that the founder can sell to people who trust them. Ten customers from a channel the company can repeat, such as inbound from a partner or a salesperson working a list, prove that the product can be sold.
- Pipeline quality. For each open opportunity, the stage, the last contact, and the next step with a date. A pipeline whose “last contact” column is three months old is a list of former conversations.
The source of those ten customers shows how dependent sales remain on the founder. Either business may be investable, but price the founder-led one on the assumption that personal selling will continue for a long time.
Ask for the numbers as a cohort. Group the customers by the month they started, and for each group count who is still there, who is paying more and who has left. A company with thirty customers can produce this in an afternoon, and a company that cannot produce it does not know its own retention.
Approaching Series A
The investor who prices the next round is buying repeatability. They want a sales motion that produces customers without the founder in every meeting, retention that holds in cohorts old enough to have renewed, a margin structure that survives the customers getting larger, and a plan whose next twelve months are an extrapolation of the last twelve.
Thresholds vary by fund and market conditions. Ask what evidence the next investor will require, using the same four measures across a larger customer base.
Your question is whether this company can reach that bar on the money it is raising now. Work it backwards. Take the customer count and revenue the plan shows at the end of the runway, and ask which of the four kinds of evidence the company will be able to show at that point.
Then ask the founder who the next investor is and what that investor has told them they want to see. A plan that ends at the money has not been thought through past this round, and the first screen treats that as a legitimate decline.
Most seed companies do not raise the next round on schedule. Carta, a US cap-table platform reporting on its own customers, published in February 2025 that historically 25 to 30 per cent of seed-funded companies reached a Series A within 24 months, and that of those seeded in 2022 about 17 per cent had.
These figures describe Carta’s American customers, with an undisclosed sample size. They illustrate the risk of delay but cannot establish a Norwegian probability.
Plan for the likelier case, and ask the founder what the company does if the Series A does not arrive on time. A bridge from existing investors, a smaller round, or a route to break-even are answers; “it will” is a plan to come back to you for money.
The cohort a seed company can actually show is the customer list grouped by start month. Who bought, who renewed, who expanded and who left, with names and dates, is what a Series-A investor will read first when the time comes, and it is the same document that tells you today whether that reading will go well.
Vanity metrics and dressed numbers
The distinction between vanity and actionable metrics is Eric Ries’s. The TechCrunch summary of it names the usual suspects as registered users, downloads and raw page views, which are easily manipulated and do not necessarily correlate with active users, engagement, the cost of getting new customers, and revenue and profit.
Josh Kopelman’s line in the same piece is the substitute to ask for: “The real data is retention and repeat usage.” Every dressed number has a check, and most checks take minutes once you have the export.
| The claim | How it is dressed | The check |
|---|---|---|
| “Users” | Registered accounts, downloads or sign-ups presented as people using the product | Ask for active users by week for the last six months, with the definition of “active” the company uses internally |
| Growth | A cumulative chart, which can only rise, presented as growth | Ask for the monthly figures the chart was built from. A cumulative line hides a business that stopped growing a year ago |
| Revenue | Gross merchandise value, the total transacted through a marketplace, presented as the company’s revenue | Ask for the take rate and the revenue the company actually recognised |
| Recurring revenue | Bookings, signed contracts not yet delivered, or one-off pilot fees presented as annual recurring revenue (årlige gjentakende inntekter) | Ask for the recurring-revenue definition and subscription-level MRR calculation, reconciled to invoices and receipts with billing-frequency differences explained |
| Growth rate | A percentage off a tiny base, such as 300 per cent growth from three customers to twelve | Ask for the absolute numbers and the base month. A percentage on a handful of customers reports the denominator |
| Customers | Pilots, trials, letters of intent and “in discussion” logos counted together | Ask for the paying-customer list with price paid and start date |
| Retention | Net revenue retention, which nets expansion against losses, presented as the retention rate | Ask for gross churn by cohort, which cannot be offset by upselling the customers who stayed |
| Engagement | Total sessions or time on site, driven by a few heavy users | Ask for the distribution: how many customers used the product each week, and how many of those used the core feature |
Ask for the export behind each number to check several of these issues at once. A founder who produces it in a day has been reading it; a founder who needs a week has been building it.
Asking for the raw numbers
Ask for four exports and run the checks in an hour. It is the last step you do alone, and what it turns up becomes the agenda for financial due diligence.
- Monthly revenue by customer for the last twelve months, one row per customer, with acquisition source, start date and end date where there is one.
- The cohort retention table: customers grouped by start month, with the count still paying in each later month.
- The definition of annual recurring revenue in use, in writing, and the figure it produces for the latest month.
- The pipeline, with stage, last contact date and next step for each opportunity.
The checks are reconciliations. The customer rows should sum to the revenue on the traction slide, and the paying-customer count on the slide should equal the rows with revenue in the latest month.
Under an annualised-MRR definition, ARR divided by twelve equals monthly recurring revenue, not that month’s invoices. Reconcile the run rate to active subscriptions, then explain differences from invoicing and receipts, including annual billing, one-off charges and start dates. Check customer departures against both the customer list and the cohort table.
Once the figures reconcile, you can use them in your valuation. If they do not, begin the next meeting with the discrepancy and note how the founder responds; that response gives you an indication of future reporting.
The evidence requirements apply to every investor. Your experience and role determine where to spend the time.
- A first-time angel asks for the customer list and the four exports on every case that passes the screen, and runs the reconciliations before the second meeting.
- An experienced angel goes to the cohort table first and spends the meeting on the oldest cohort, where the renewal decision has already happened.
- An angel with a sector focus calls two customers from the list, chosen by the angel and not the founder, and asks what they would do if the product disappeared.
- An angel in a syndicate has one member own the exports and the reconciliation, so the founder sends the files once and the group argues about the same numbers.