
How a deck dies in the first two minutes
DocSend measures investor reading time for pitch decks shared through its platform. Its update of 10 June 2024 reported an average of 2 minutes 18 seconds for the preceding week. That is a dated platform measure, not a current estimate for all decks or Norwegian angels. The practical lesson is to make the opening easy to scan and the main evidence easy to find.
These mistakes give investors reasons to stop reading and draw conclusions about the company or its founders. A rebased axis, for example, can look less like a chart error than an attempt to discourage scrutiny.
The reasons angels give for declining are consistent. EBAN’s survey of 683 angels across 41 countries, run in 2016 and 2017, found that a high risk of failure and an exaggerated valuation were the two main reasons for not investing. Only 7 per cent named a low expected return.
The same survey found that around three quarters of respondents had met founders who were not yet investment-ready. Those are European figures from a 2016–17 survey, and the pattern holds: the reader is looking for what will go wrong, and for a price that ignores it.
You can fix most of these problems in an afternoon with the deck open. Do so before sending it, since it may be forwarded to people you will never meet.
Market-slide failures
The one-per-cent slide. A huge market figure and a plan to capture one per cent of it do not show who will buy from you. Guy Kawasaki’s list of claims investors hear most includes both the research-firm figure and “All we have to do is get 1% of the market”.
His point is that the claim underestimates how hard it is to win customers. Build the estimate from the bottom up: name the segment, count its buyers, estimate what each pays and show how many you can reach during the funded period.
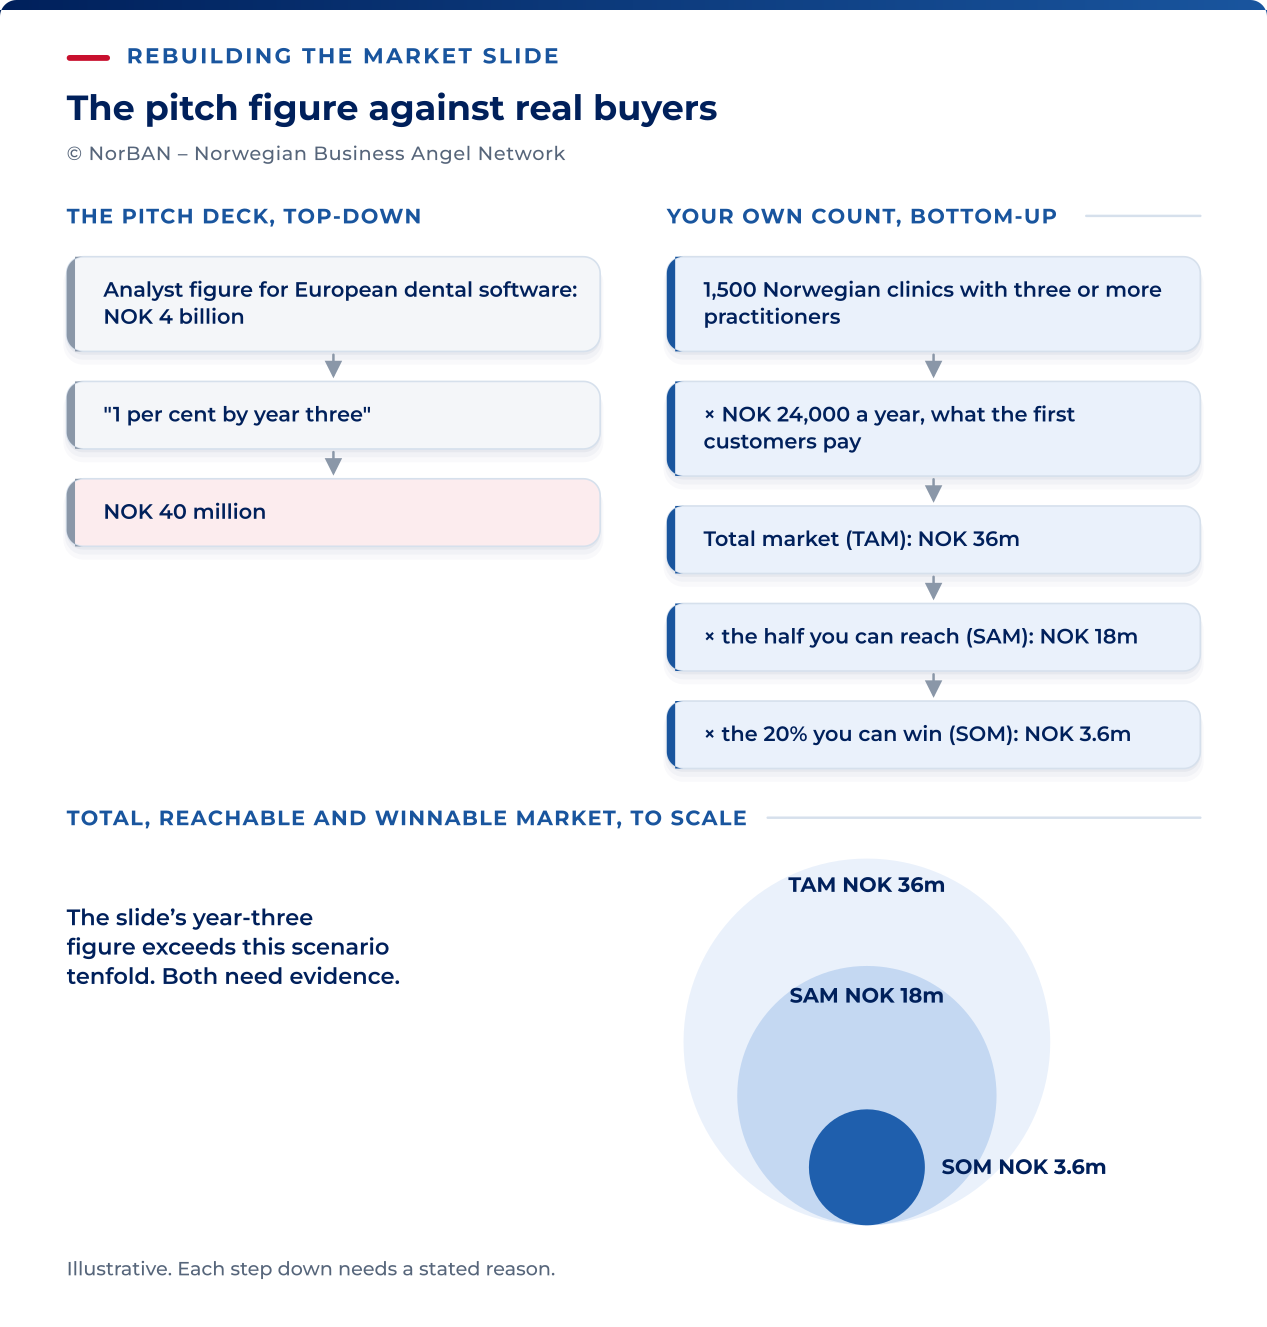
A market described, where it should be defined. “Small businesses in the Nordics” is a description. A defined segment can be counted, and the reader checks whether you have counted it. Name the buyer type, the size of the company, the event that makes them buy, and where they can be found.
No path from the market to the first customers. A slide that sizes the whole market and then jumps to revenue leaves out the part the reader wants: who the first hundred buyers are, and how they will be reached. Investors want to understand the buyer. A market slide needs to identify that person before the traction slide shows whether they are buying.
Traction theatre
Vanity metrics. Sign-ups, downloads, followers, pilot conversations. The reader looks for the number that involves money changing hands, and when it is absent concludes it is absent for a reason. Lead with paying customers, revenue and retention. Put the rest below them, or leave it off.
Customer status and revenue mixed together. A paid pilot can be a customer and can generate revenue. An unpaid trial, an expression of interest and an ordinary customer contract are different things. Label each accurately, and recognise revenue under the applicable accounting rules. For example: “Three ordinary paying customers, two paid pilots and four prospects.” This tells the investor more than an unexplained total of nine customers.
One large account presented as momentum. Revenue from one or two customers can disappear if they leave. Presenting that concentration as momentum without acknowledging the risk suggests you have overlooked it. Show the concentration yourself and say what is being done about it.
Charts that exaggerate growth. Label both axes and use consistent time intervals. A bar chart normally needs a zero baseline because bar length represents magnitude. A line chart may use a narrower range to show changes, but make the scale clear and avoid giving a misleading impression. Explain any change of scale or time period.
In seed decks reviewed on its US platform, DocSend reports 80 per cent more time on traction slides from companies that did not go on to raise. That association does not explain why an investor lingered. Make the evidence clear and ask what needs clarification; time spent alone proves neither interest nor doubt.
The same European survey found that good traction is widely acknowledged as reducing risk, so the slide carries weight in your favour when it is plain. Overstated, it converts the reader’s strongest reason to invest into their strongest reason to stop.
The claims investors have heard before
Some claims appear so often that investors learn more from your decision to use them than from the claims themselves. Kawasaki published his list of them in 2006, and it has aged well because the lines have not changed.
- “Our projections are conservative.” He has never seen a founder achieve even the most conservative projection. Say what the projections assume, and let the reader decide what to call them.
- “No one is doing what we’re doing.” The reader hears either that there is no market or that you have not looked. Name the alternatives, including doing nothing.
- “No one can do what we’re doing.” A large incumbent can do most things. The question is whether it will bother in time, so say why it will not.
- “Hurry because several other venture capital firms are interested.” Kawasaki puts the number of founders who can say this truthfully at about a hundred in the world, and the reader assumes you are one of the others. Real competition for a round shows in the timetable and needs no announcement.
- “We have a proven management team.” Proven at what. Name the relevant thing each person has done before, and where.
- “Patents make our product defensible.” Mention them once. A slide that dwells on them signals that the defence is legal and the commercial one is missing.
- “Key employees are set to join us as soon as we get funded.” Named people who have agreed in writing count. Everyone else is a hiring plan.
Financial-slide failures
Growth without explained assumptions. A round annual growth percentage does not tell the reader how the business will achieve it. Manual inputs are normal in a financial model; the question is whether the forecast follows from explicit assumptions. Build the slide from customer numbers, prices, churn and acquisition costs, and be ready to explain what happens when those assumptions change.
The hockey stick with no mechanism. Flat for two years, vertical in the third. Investors can accept steep growth if the slide explains what will cause it. Show what changes in the year the curve turns, and what it costs.
Numbers that disagree with each other. The deck gives one revenue figure for year two, the model another and the one-pager a third. The reader stops trusting all three. Use one set of numbers generated from one model, and put the date on the slide.
An ask that does not match the plan. The plan costs one amount over eighteen months and the ask is a different amount. The reader assumes that either the plan or the ask was invented. Tie the ask to the months it funds and the milestone it reaches, from the same model that produced the growth slide. A valuation set far above what the stage supports does the same damage, and is one of the two main reasons angels give for declining.
Team and cap-table signals
Gaps left unacknowledged. Three technical founders, nobody who has sold anything, and a slide that does not mention it. The reader sees the gap in seconds and then wonders what else you have not seen. Name the gap and the plan for it. Investors ask directly whether a team understands and is realistic about its weaknesses and obstacles, and they score the answer.
Advisors doing the team’s work. A row of well-known names, and a team slide that is thin without them. The reader discounts advisors to the hours they actually give. State what each advisor does, and how often.
A cap table that needs explanation. A departed co-founder with a large holding, a controlling early investor, convertible instruments or an unallocated option pool may prompt questions. An uncapped convertible is not inherently defective: explain its terms and show dilution under different outcomes. Resolve actual problems before fundraising and describe the remaining issues and your proposed steps. Founder disagreements need to be addressed in the underlying arrangements, not merely explained away in the deck.
Failures of form that read as failures of substance
The deck may be an investor’s first sample of your work. Careless presentation can make them question whether the product, accounts and board minutes receive the same treatment.
- Too many slides. Keep the send-ahead version to the eleven main topics discussed here. Put supporting detail in an appendix or the data room.
- Too much prose. Long paragraphs are difficult to read on a phone. Give each slide one clear point, with the supporting evidence below it.
- An unclear funding request. State how much you want to raise, on what terms and what the money will fund.
- A file that is hard to open. Make the deck accessible without requiring a particular app.
- Information that conflicts with other materials. Reconcile the deck with the one-pager, model and data room. Contradictory information can undermine trust in the company.
The pre-send checklist
Work through these checks with your deck open and resolve the problems before sending it.
| Anti-pattern | What the investor concludes | The fix |
|---|---|---|
| A research-firm market figure and a one-per-cent plan | Nobody has counted the buyers. | Size the market bottom-up from a segment you can name and count. |
| A market described in adjectives | The segment is undefined, so the plan cannot be checked. | Name the buyer type, the size of the company, the buying trigger and where they are found. |
| No route from the market to the first customers | The go-to-market plan does not exist. | Say who the first hundred buyers are and how each is reached. |
| Sign-ups and downloads leading the traction slide | No money has changed hands. | Lead with paying customers, revenue and retention. |
| Customer categories mixed together | The customer count is hard to assess | Distinguish ordinary paying customers, paid pilots, free trials and prospects; recognise revenue under the accounting rules |
| One or two accounts presented as momentum | The founder has not noticed the concentration risk. | Show the concentration and the plan to reduce it. |
| A growth chart with unclear scales | The chart may exaggerate growth | Label axes and time periods. Normally start bars at zero; make any narrower line-chart range explicit |
| “Conservative projections” and the other lines on Kawasaki’s list | The founder is running a script the reader has heard before. | Replace each line with the specific fact behind it. |
| Growth figures without explained assumptions | The forecast is hard to assess | Show how customer numbers, prices, churn and costs produce the forecast |
| A hockey stick with no visible cause | The curve describes a wish. | Show what changes in the year the curve turns, and its cost. |
| Numbers that differ between deck, model and one-pager | None of the numbers can be trusted. | One model, one set of figures, dated. |
| An ask that does not match the plan’s cost | Either the plan or the ask was invented. | Derive the ask from the runway and the milestone. |
| A valuation far above the stage | The price ignores the risk. | Price the round to the evidence, and say what the evidence is. |
| A team gap the slide does not mention | The founders do not see their own weaknesses. | Name the gap and the hiring plan. |
| Advisors carrying the team slide | The team is thin. | State what each advisor does and how often. |
| A cap table with unexplained ownership or conversion terms | Ownership and dilution need discussion | Explain the terms and model dilution. Resolve actual problems; an uncapped convertible is not inherently defective |
| Forty slides, paragraph text | The founder cannot decide what matters. | Eleven elements, one claim per slide, evidence under it. |
| No ask on any slide | There is no decision to take. | Amount, instrument, what it funds. |
| A claim the data room will contradict | The founder is not transparent. | Reconcile every number in the deck to the model and the room before sending. |