
Rebuilding the market size bottom-up
The market slide is the least reliable page of the deck and the easiest to check without the founder. A market-size claim is a calculation, and the slide gives you its result and rarely its inputs. Redo it with your own inputs before the first meeting, and take the difference into the room.
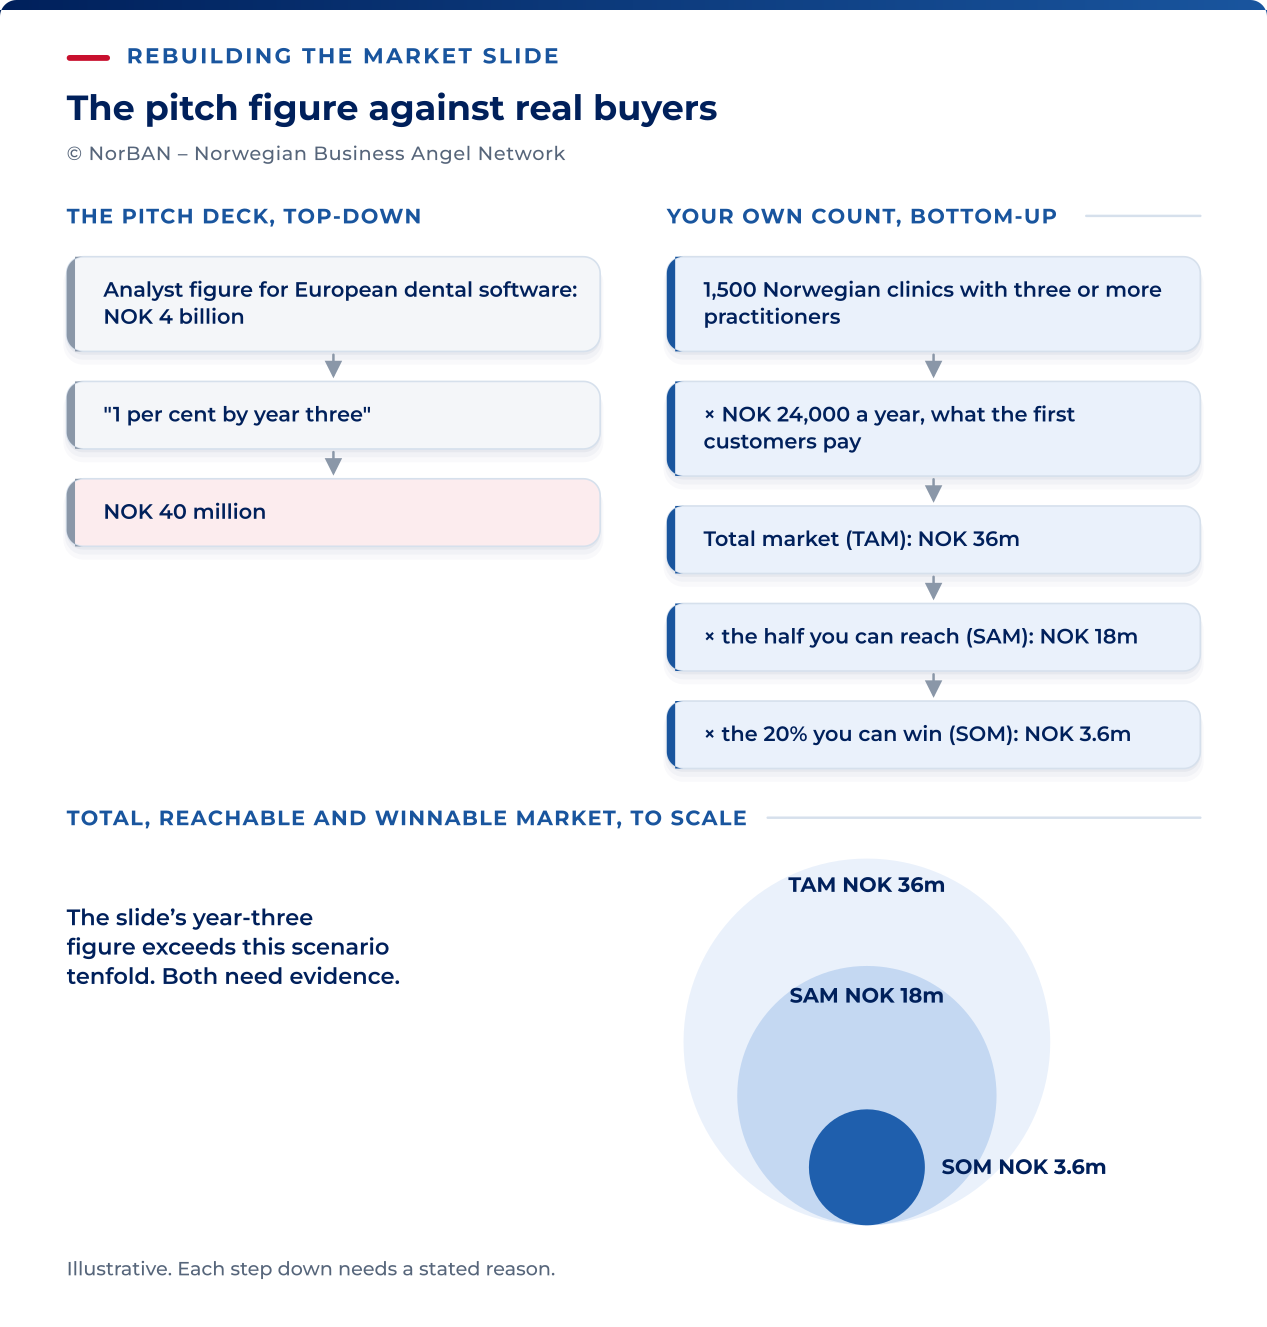
The total addressable market (TAM) is the annual revenue the company would earn at 100 per cent share of the market it has defined, which is Bill Aulet’s definition in MIT’s Disciplined Entrepreneurship.
His method is bottom-up. Divide the market into countable units, find real instances of them, count the end users in each, and ask what each pays a year.
The serviceable addressable market (SAM) is the part of that total the product and the channel can reach as they stand today. The serviceable obtainable market (SOM) is the share of the SAM the plan claims within its horizon.
Calculate both from the same customer and price assumptions. SAM is a fraction of TAM, and SOM is a fraction of SAM; the founder should be able to justify each reduction.
Decks usually take a top-down approach, starting with an analyst’s category figure and projecting a percentage of it as future revenue. Aulet is direct about the method: top-down estimates are easier to produce, miss important subtleties and are usually overly optimistic.
Guy Kawasaki’s list of entrepreneur claims carries both halves of the pattern, “(Big name research firm) says our market will be $50 billion” and “All we have to do is get 1% of the market”. Both are American observations about American decks, and both describe Norwegian decks well.
Suppose the company sells booking software to dental clinics, and the first customers pay NOK 2,000 a month. The rebuild runs as follows, with the top-down version beside it.
| Step | The slide, top-down | Your rebuild, bottom-up |
|---|---|---|
| Starting point | An analyst’s figure for European dental software of NOK 4 billion. | Clinics in Norway with more than two practitioners, the segment the product was built for. The founder’s list, checked against the business register, gives 1,500. |
| Price | Implied by the category figure. | NOK 24,000 a year, the price the first customers actually pay. |
| TAM | NOK 4 billion. | NOK 36 million a year at 100 per cent share of the segment. |
| Reachable share | “1 per cent by year three”, NOK 40 million. | Clinics the current channel can reach, say half, gives a SAM of NOK 18 million. A SOM of 20 per cent of that is NOK 3.6 million, and the plan must say how. |
The two methods produce different estimates. The bottom-up result estimates the first market under the assumptions shown. Test those assumptions before relying on it; the second market requires its own evidence, as the last section explains.
A company can be a good investment at a TAM of NOK 36 million if the second market is real, and a poor one at a slide figure of NOK 4 billion that no customer count supports.
Public sources can resolve many of these claims in minutes. Start with the business register: filed accounts let you check both the founder’s company and the competitors described in the deck.
| What you need | Where to look | What it settles |
|---|---|---|
| A count of customers in the segment | Statistikkbanken at Statistisk sentralbyrå for industry, population and household counts; Brønnøysundregistrene for registered companies by activity. | Whether the founder’s count is a count or a guess. |
| A claimed competitor’s real revenue | The competitor’s filed annual accounts at Brønnøysundregistrene, available for every Norwegian AS. | Whether the competitor is as small, or as large, as the deck says. |
| A claim about selling to the public sector | Doffin, the national procurement database. | Whether the tenders exist and who won them. |
| A second market’s size on the same basis as the first | Eurostat. | Whether the European figure is built the way the Norwegian one was. |
| Industry statistics from a branch organisation | The organisation’s own publications. | Useful for structure. They are advocacy publications, so cite them as such or leave them out. |
Demand you can verify
A market of the right size can still hold no urgent demand. In CB Insights’ post-mortem analysis of United States venture-backed companies that shut down from 2023 onwards, poor product-market fit was named in 43 per cent of the failures with an identifiable cause.
Those are American, venture-backed companies, and the pattern travels. A product that solves a problem the buyer will not pay to have solved fails whatever the market size says.
Test demand by asking how well the founder knows the customer. Look for specific answers grounded in contact with buyers:
- Who is the customer, in detail, and which person inside the customer decides?
- What makes one customer worth pursuing over another: decision timeframe, budget, expertise in the area, loyalty?
- Do the customers know that what the company sells exists, and where are they on the decision-making curve?
- How do they make the decision, and what hidden motivations, pains and goals sit behind it?
- What are the customers like as people, and how does that shape the sale?
- Who pays, and is the payer the same person as the user?
- Why did the existing customers buy, and what did they use before?
Follow up on what customers used before. What the customer does today instead is the real competitor in every early market, and doing nothing is the usual answer.
Compare the value of solving the problem with the full cost of adopting the product, including training and integration. Then test whether customers have the budget, authority and willingness to buy.
Rank the evidence of demand by what the customer gave up for it, from most to least, and read the deck’s traction claims against the ranking.
- Paid, and renewed or expanded.
- Paid once.
- A paid pilot.
- A free pilot with a named decision-maker and a date.
- A letter of intent.
- Interest, logos and conversations.
Anything below a paid pilot is a claim about the future. It gets tested in due diligence (selskapsgjennomgang) by calling the customers, so note now which ones you would call.
The why-now case
Every deck has a why-now slide, and the useful test is whether each timing driver has a fact behind it. For each reason the founder gives, ask for the evidence and when it will affect buying decisions.
| Driver | What counts as evidence | What counts as narrative |
|---|---|---|
| A regulation | The act or regulation, its commencement date, and the obligation it puts on the buyer. | “Regulation is tightening.” |
| A cost curve | A component or input price, sourced, with the level at which the business model works. | “Costs are falling fast.” |
| A platform shift | A user or installed-base count for the platform the product rides on, from the platform’s own reporting. | “Everyone is moving to it.” |
| A behaviour change | A measured change in how the buyer buys or works, with a source and a date. | “After the pandemic, customers expect this.” |
Timing risk runs both ways. Too early, and the round is spent educating a market that is not ready to buy, with the runway ending before the customers arrive. Too late, and the company meets incumbents who already ship the feature.
In the same CB Insights analysis, bad timing or macro conditions was named in 29 per cent of the failures with a cause, which puts it beside capital and fit as a reason companies end.
Ask how quickly the technology trend is moving, and whether this idea can gain a foothold before something newer overtakes it. A founder who can name the next technology that threatens the product, and say why the customers will already be theirs by then, has thought about timing. One who says the technology is settled has not.
Mapping the competition honestly
The competition slide names two or three companies with a feature matrix in which the startup wins every row. Rebuild it in three parts, each checked from a different source.
| Competitor type | What to check | Where to look |
|---|---|---|
| Direct competitors | Their real revenue and headcount, their pricing, and what they shipped in the last year. | Filed accounts at Brønnøysundregistrene for Norwegian companies; their own release notes and pricing pages; a reference customer who evaluated both. |
| Substitutes | What the buyer uses today that is not a competitor product: a spreadsheet, a consultant, a module inside a system they already run. | The customer calls. Ask what they did before and what they would go back to. |
| The status quo | What it costs the buyer to keep doing nothing, and who inside the customer benefits from nothing changing. | The customer calls, and the founder’s own account of lost deals. |
Then look at the established players. Ask who the big players in the space are and what they are working on now. Where they are working on something similar and are established members of the supply chain the startup has to enter, a new solution will find it hard to compete, however good it is.
A distributor that also sells the incumbent’s product, a systems integrator whose margin depends on the old way, and a buyer whose existing supplier bundles a version of the feature are all competition, and none of them appears on the slide.
Ask the founder directly how likely it is that a competitor could do something similar in the same period and for a similar cost. Then form your own view.
A funded competitor with an existing customer base and a sales force can copy a feature in a year; a customer relationship, a dataset or a certification takes it longer, and those are what the moat section tests.
The claim that there is no competition is common, and it usually means one of three things: the founder has not looked, the honest slide is uncomfortable, or the market does not exist. Each is a different question for the meeting, and the first two can be fixed.
Moats that survive contact
Use a year as a practical challenge, not a definition of a moat: what could a well-funded competitor reproduce in that time, and what would remain difficult? Test the answer against evidence. If the advantage still has to be built, price it as a plan the round will fund.
| Moat | Evidence it exists today | Warning sign |
|---|---|---|
| Network effects | Each new user measurably raises the value for existing users, shown in retention or usage rising with the size of the network. | “Once we have scale, the network will lock customers in.” No mechanism named. |
| Switching costs | Customers have integrated the product into their own systems or data, and a reference customer can say what leaving would cost. | The product sits beside the customer’s systems and can be turned off in a day. |
| Data advantage | A dataset competitors cannot buy or collect, and a product that gets measurably better with it. | Data that any competitor’s customers would generate for them just as fast. |
| Distribution | A channel partner with signed terms and customers already delivered through it, or a sales motion with a repeatable cost per customer. | A partnership announced but not yet selling. |
| Regulatory position | A certification, approval or licence held now, with the time and cost it took stated. | An approval “in progress” with no date. |
| Intellectual property | Rights registered or applied for, in the company’s name, covering what the product actually does. | A patent mentioned with no account of what it covers, which the product and technology assessment tests. |
Do not expect a finished moat at seed. What you are underwriting is the speed at which one of them can be built with this round, so ask which moat the plan is building and what the milestone looks like in twelve months.
The small home market and the route out
Norway is a small market by any measure, and a company that can only ever sell here will rarely reach the size a venture return needs. The market case for a Norwegian startup therefore usually rests on the route out.
The deck should treat expansion as part of the plan, with a first foreign market named and a reason for choosing it. Nordic evaluation practice scores the expected rate of expansion inside and outside the region as a criterion in its own right, and it is worth scoring the same way.
At seed, expansion evidence will be limited. Look for early work that makes the plan credible:
- A product that is export-ready: language, currency, and any regulatory or data-residency requirement of the first foreign market already handled or costed.
- A first foreign customer, or a paid pilot abroad, however small.
- A channel partner or distributor in the target market with terms agreed.
- A founder who has sold in that market before, or a hire planned who has.
- A Nordic neighbour as the first step, with a stated reason it is easier than the market after it.
Treat the home market as the proof of concept and the first foreign market as the business. Rebuild the size for both, on the same basis, and ask the founder which milestone in this round moves the company from the first to the second.
If the plan uses up the runway without producing evidence from a foreign market, the next investor will still need to verify the harder part of the market case. Establish what this round will do to address it.